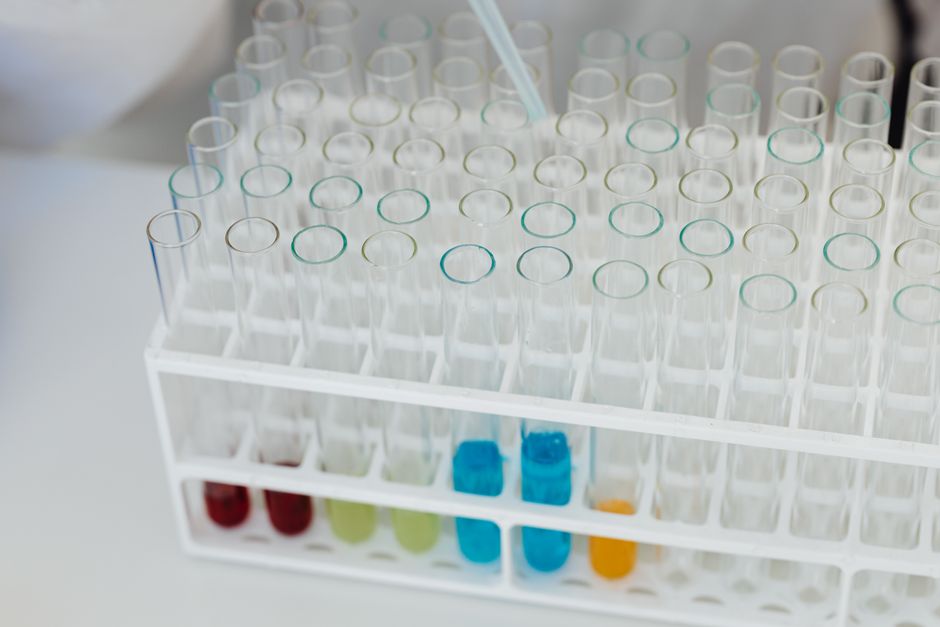
Water scarcity is no longer a distant threat. Projections for 2026 show that nearly half the global population will experience severe water stress at least one month per year. The data matters for anyone building an off-grid water system, whether through a private well, rainwater harvesting, or atmospheric generation. Understanding regional pressure points helps you choose the right technology and prepare for future risks.
Our analysis draws on the World Resources Institute’s Aqueduct tool, UN-Water reports, and WHO global water quality standards. These numbers shape the decisions of off-grid homeowners, from well drilling cost to investing in rainwater collection systems.
| Region | Population Facing Scarcity (millions) | % of Regional Pop. | Primary Driver | Projected Water Stress Index (2026) | Key Impact |
|---|---|---|---|---|---|
| Middle East & North Africa | 170 | 45% | Arid climate, over-extraction, political conflict | 4.5 (Extreme) | Crop failure, mass migration |
| Sub-Saharan Africa | 340 | 28% | Climate variability, poor infrastructure | 3.9 (High) | Famine risk, disease outbreaks |
| South Asia | 280 | 14% | Population growth, agricultural demand, pollution | 3.8 (High) | Groundwater depletion, rural poverty |
| East Asia & Pacific | 200 | 8% | Rapid urbanization, industrial use | 2.8 (Medium-High) | Supply interruptions, increased treatment cost |
| Latin America & Caribbean | 75 | 12% | Deforestation, seasonal drought | 2.2 (Low-Medium) | Hydropower curtailment, urban rationing |
| North America | 45 | 8% | Groundwater depletion, prolonged drought | 2.5 (Medium) | Well failures, higher food prices |
| Europe & Central Asia | 90 | 12% | Aging infrastructure, pollution | 2.1 (Low-Medium) | Higher water bills, sector decline |
Data projections for 2026 based on WRI Aqueduct 4.0, UN-Water 2025 updates, and regional hydrological models. Water Stress Index: 0-1 (Low), 1-2 (Low-Medium), 2-3 (Medium-High), 3-4 (High), 4-5 (Extreme).
Why the Middle East and North Africa Faces the Worst Water Scarcity
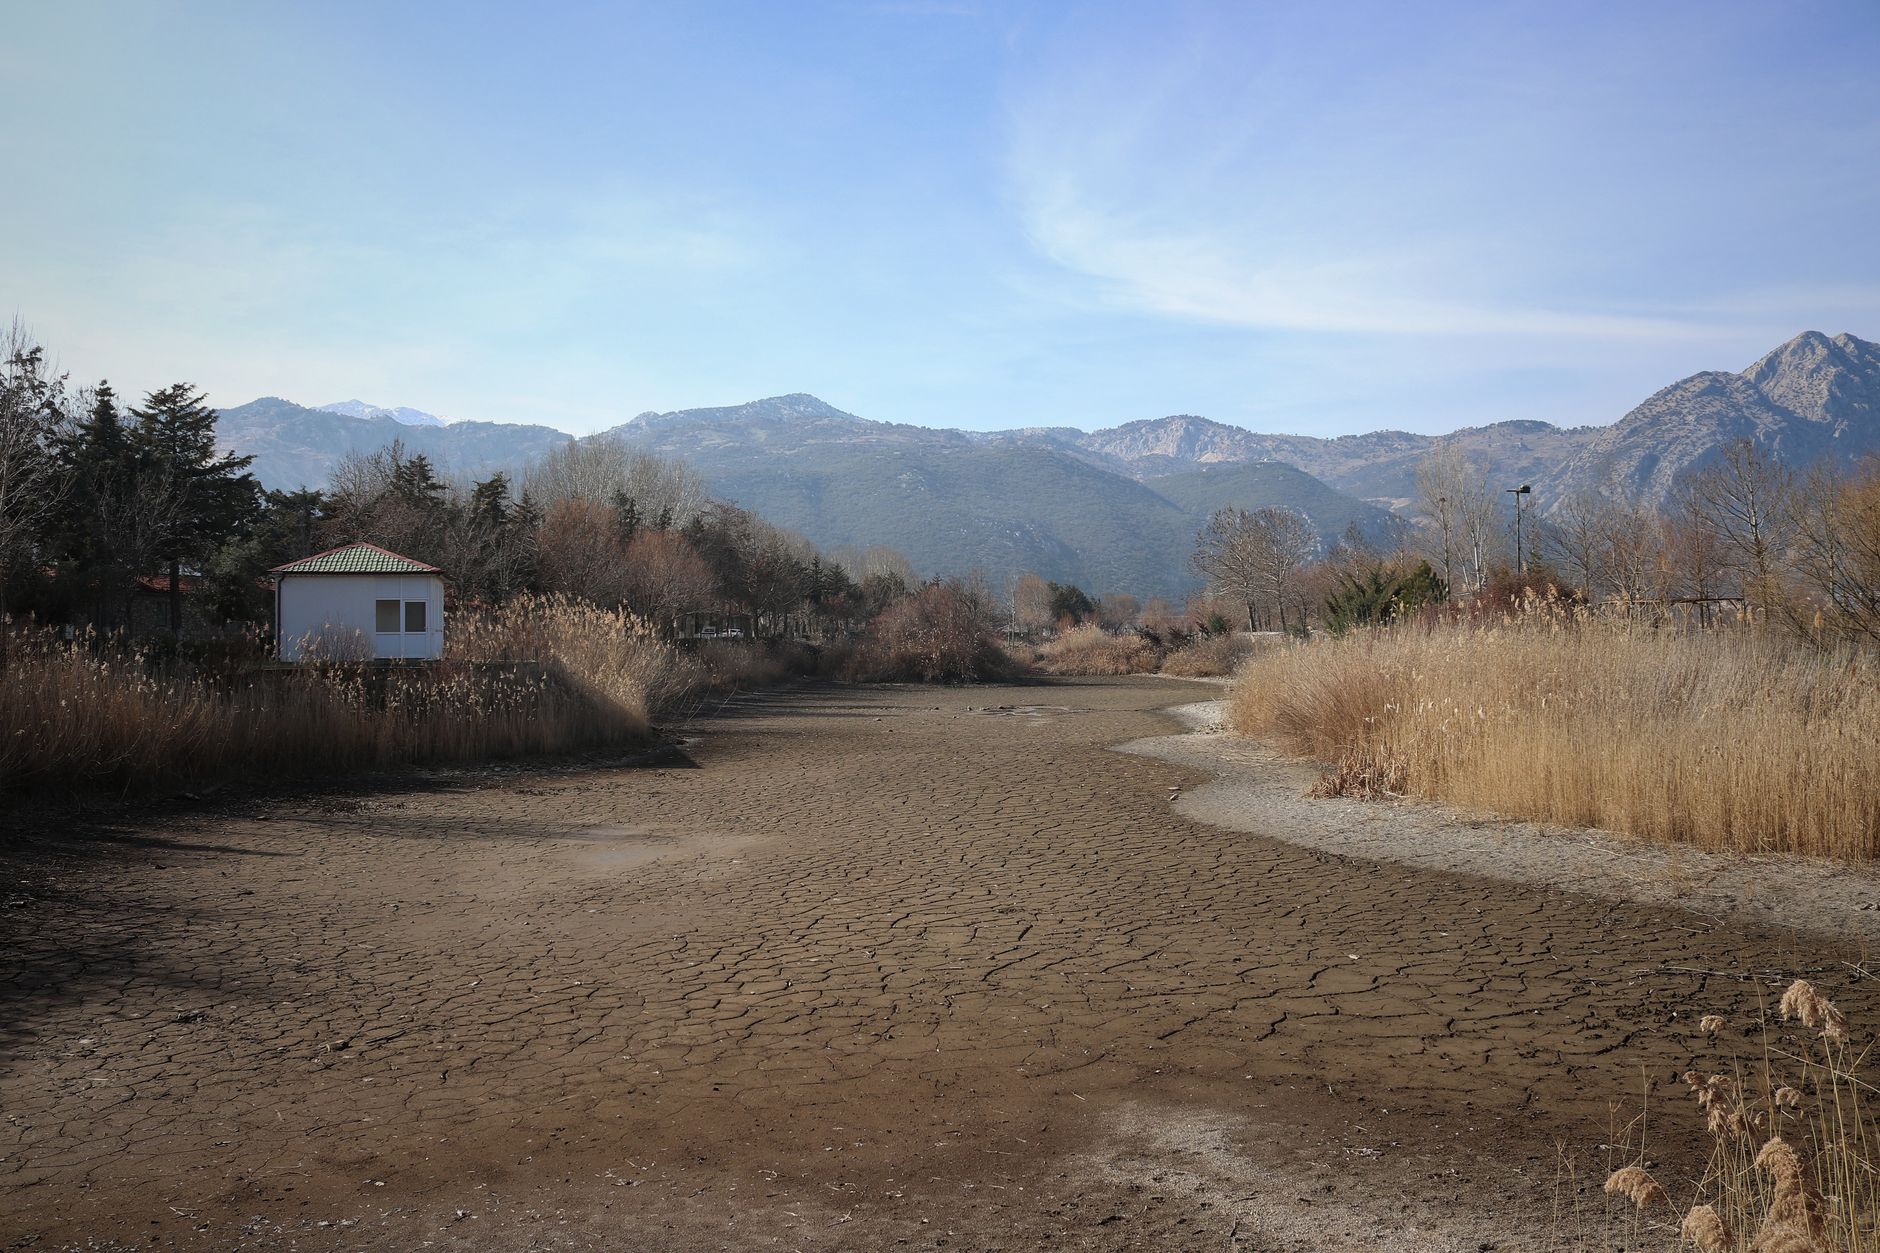
The Middle East and North Africa (MENA) region consistently tops water stress charts. By 2026, 45% of its population will face absolute water scarcity. The main culprit is a combination of arid climate and decades of groundwater over-extraction. Many aquifers in Saudi Arabia, Yemen, and Iran are being depleted faster than they can recharge. Political instability further cripples water management. Investments in desalination provide a partial fix, but the high costs and brine disposal concerns limit widespread adoption. For off-grid homesteaders looking at similar arid conditions, the atmospheric water generators guide offers a smaller-scale alternative that extracts moisture from the air without tapping groundwater.
- Twelve of the world’s 17 most water-stressed countries are in MENA.
- Agriculture consumes 85% of freshwater in the region.
- Seawater desalination meets over 70% of drinking water demand in Gulf states.
How Groundwater Depletion Is Accelerating Global Water Stress
Groundwater supplies nearly half of all drinking water worldwide and 43% of irrigation. Yet it is vanishing rapidly. In South Asia and North America, aggressive pumping has lowered water tables to dangerous levels. A 2026 projection shows that 40% of India’s population will lack reliable groundwater access. In the United States, the Ogallala Aquifer continues to shrink, forcing many rural homeowners to drill deeper wells. The EPA groundwater and drinking water standards set safety benchmarks, but they cannot stop resource depletion. Before drilling, review our well drilling guide to understand depth requirements and potential yield. Also, regular water testing for wells becomes critical as mineral concentrations often rise when water levels fall.
- Global groundwater extraction increased 1% per year from 2010 to 2025.
- California’s Central Valley has seen land subsidence of 10 feet in some areas due to overpumping.
- NGWA well construction standards help mitigate cross-contamination during drilling.
Off-Grid Solutions for Water-Scarce Regions
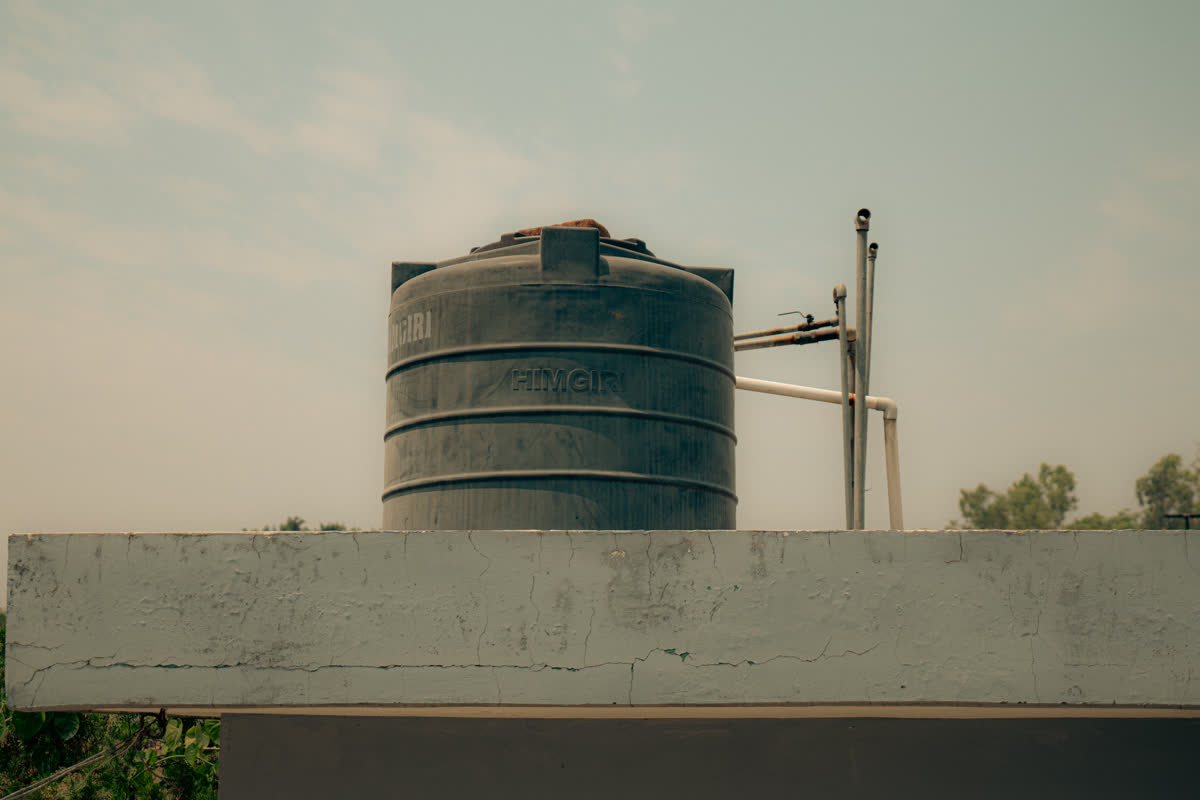
The 2026 scarcity data underscores why off-grid water systems are gaining traction. In regions with seasonal rainfall, rainwater harvesting can offset municipal shortages. A properly designed collection system paired with a water storage tank maintenance guide ensures safe supply through dry spells. In areas with chronic water stress, combining multiple sources works best. For instance, a deep well supplemented by atmospheric water generation reduces strain on any single source. Our off-grid water systems article covers integrated designs that work even under extreme stress levels. While the global outlook is sobering, individual preparedness can turn the tide for your own household.
- A 1,000 square foot roof can collect 600 gallons from 1 inch of rain.
- Atmospheric generators produce 2-10 gallons per day even in low-humidity conditions.
- The WHO recommends at least 15 liters per person per day for basic needs.
Frequently Asked Questions
Which region will have the worst water scarcity in 2026?
The Middle East and North Africa remains the most water-scarce region, with 45% of its population projected to face absolute scarcity by 2026.
How do you define water stress in these statistics?
Water stress measures the ratio of total water withdrawals to available renewable surface and groundwater supplies. A stress index above 3.0 indicates high competition among users and significant depletion.
Can off-grid systems really offset regional water scarcity?
Yes, for individual households. Rainwater harvesting, deep wells, and atmospheric generators can provide a reliable supply even in water-scarce regions, but they require careful planning and maintenance.
What is the primary driver of water scarcity in Sub-Saharan Africa?
Climate variability and poor infrastructure are the main drivers. Many communities rely on unprotected sources that are vulnerable to drought and contamination.
Why is groundwater depletion a concern for well owners?
Falling water tables mean wells may run dry or require deeper drilling. It also increases the concentration of minerals and contaminants, making regular water testing essential.
How does North America compare to other regions?
North America fares better than many regions, but groundwater depletion in agricultural areas like the Ogallala Aquifer is a growing concern. About 8% of the population faces medium water stress.
Where can I find more resources on setting up an off-grid water system?
Visit our guides on well drilling, rainwater harvesting, and atmospheric water generation. The WHO also provides household water treatment recommendations.
What Should You Remember?
- Middle East & North Africa is the epicenter of water scarcity with 45% of its population facing acute shortages.
- Groundwater over-extraction threatens supplies in South Asia and North America, making proper well siting and testing crucial.
- Sub-Saharan Africa faces the largest absolute number of people under scarcity (340 million), driven by infrastructure gaps.
- Off-grid systems such as rainwater harvesting and atmospheric generation can insulate households from regional water stress.
- Regular water quality testing becomes more important as source depletion changes contaminant levels.
- Projected 2026 data should inform your choice of backup water sources, especially if you live in a high-stress region.
This article is for general information only. Water purification and storage carry health and safety risks — always follow local regulations and manufacturer guidance.